

3月份的外汇(FX)市场可能会受到集中在本月上半月左右发布的几份具有高影响力的报告的影响。随着本月的推移,中国采购经理人指数、澳大利亚国内生产总值、日本国内生产总值和美联储3月份的会议都可能影响外汇情绪。
事实速览
- 美国的利率预期保持稳定,CME FedWatch暗示3月联邦公开市场委员会会议上不变利率的可能性超过85%。
- 中国采购经理人指数、CPI/PPI和贸易数据将有助于塑造月初的区域风险基调。
- 澳大利亚的国内生产总值、澳大利亚央行的决定、劳动力数据和消费者价格指数为澳元创造了一个集中的国内事件窗口。
- 日本国内生产总值和日本银行(BoJ)政策会议可能会影响国内收益率的重新定价和日元的波动。
- 欧元区消费者价格指数、工业生产和欧洲央行货币政策决定仍然是欧元稳定的关键。
美元 (USD)
关键事件
- 非农就业人数: 3 月 7 日上午 12:30(澳大利亚东部夏令时间)
- 消费者价格指数(CPI): 3 月 11 日晚上 11:30(澳大利亚东部夏令时间)
- 零售销售: 3 月 17 日晚上 11:30(澳大利亚东部夏令时间)
- 美联储的政策决定: 3 月 19 日凌晨 5:00(澳大利亚东部夏令时间)
- 美联储新闻发布会: 3 月 19 日上午 5:30(澳大利亚东部夏令时间)
要看什么
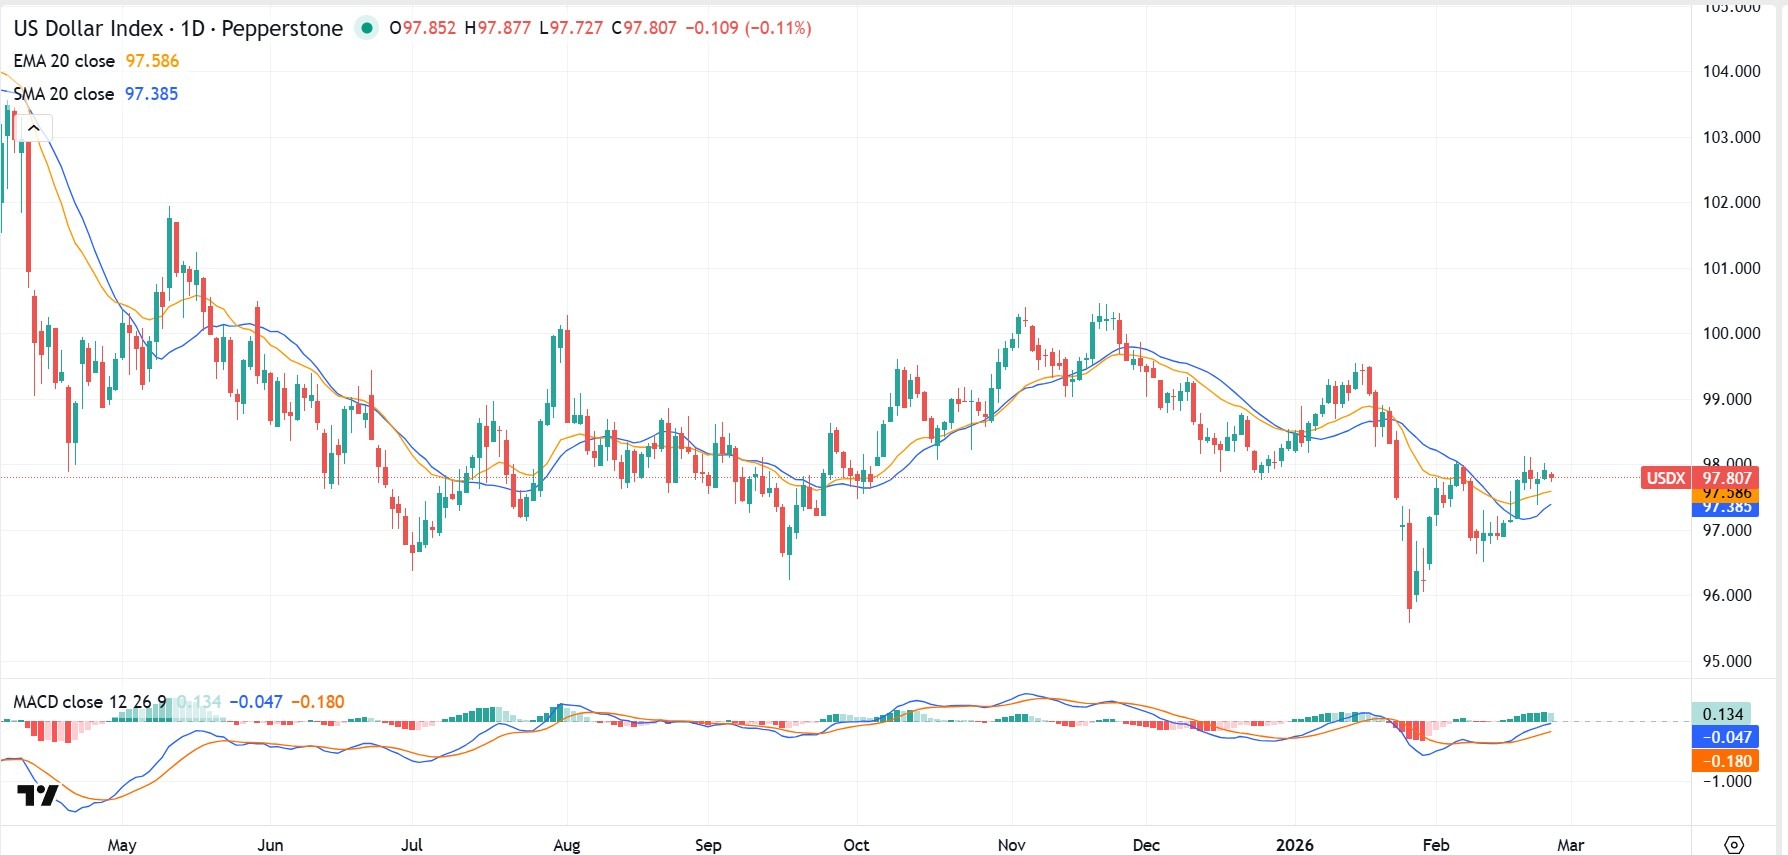
美元仍然主要受通货膨胀和劳动力数据及其对美联储定价的影响所驱动。
芝加哥商品交易所FedWatch的定价表明,在3月的联邦公开市场委员会会议上,市场认为不变利率的可能性超过85%。这表明目前的定位是以暂停为基础的,这增加了对任何可能改变预期的通胀意外情况的敏感度。
由于暂停在很大程度上,美元的走势可能更多地取决于通货膨胀轨迹和长期政策预期,而不是决定本身。更坚挺的消费者价格指数或弹性的劳动力数据可能会强化收益率支持。
关键图表:美元指数(DXY)周线图
欧元(欧元)
关键事件
- 欧元区消费者价格指数(初步估计): 3 月 3 日晚上 10 点(澳大利亚东部夏令时间)
- 欧元区工业生产: 3 月 13 日晚上 9:00(澳大利亚东部夏令时间)
- 欧洲央行货币政策决定: 3 月 20 日上午 12:15(澳大利亚东部夏令时间)
- 欧洲央行新闻发布会: 3 月 20 日上午 12:45(澳大利亚东部夏令时间)
- 欧元区采购经理人指数初值: 3月24日晚上 8:00(澳大利亚东部夏令时间)
要看什么
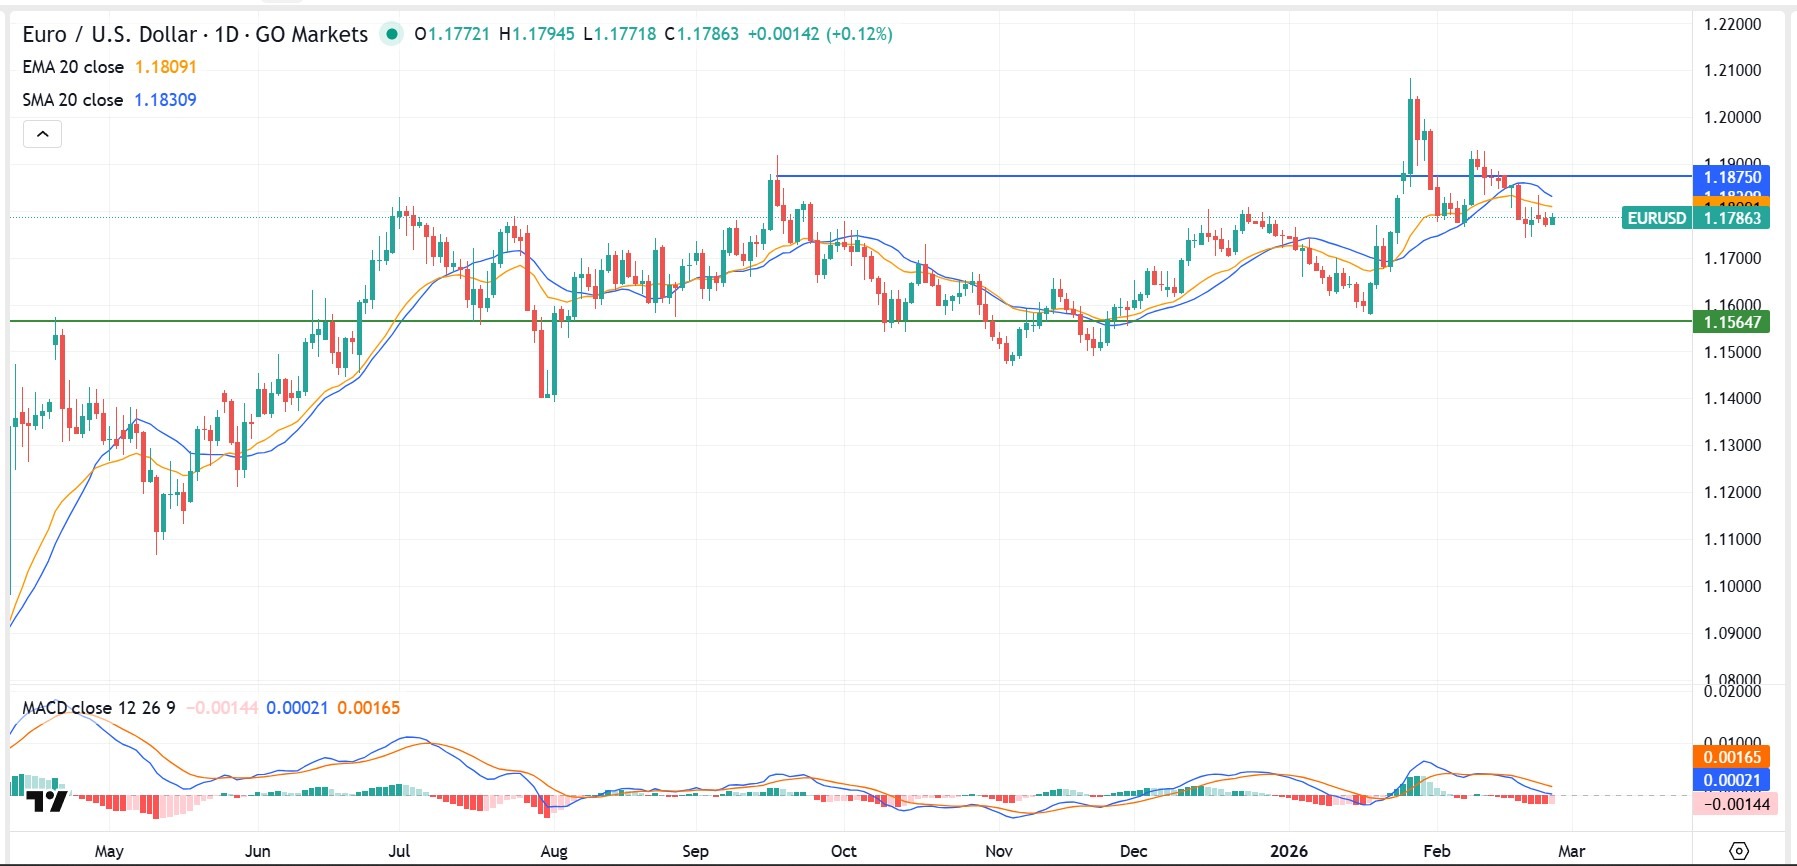
欧元的走势仍然与通货膨胀的持续性以及增长数据是否稳定了对欧洲央行政策的预期有关。
持续的通货膨胀或活动数据的改善可能会限制宽松预期并支撑欧元。通货膨胀疲软和生产数据疲软可能会增加下行压力,尤其是在美国数据保持坚挺的情况下。
欧元/美元的每日结构在今年早些时候上行延期后出现盘整。短期势头有所减缓,价格保持在长期支撑位上方。
关键图表:欧元/美元日线图
日元 (JPY)
关键事件
- 日本国内生产总值(2025年第四季度,第二次估计): 3月10日上午10点50分(澳大利亚东部夏令时间)
- 日本央行政策会议: 3 月 18 日至 19 日(澳大利亚东部夏令时间)
- 日本央行关于货币政策的声明: 3 月 19 日(澳大利亚东部夏令时间)
要看什么
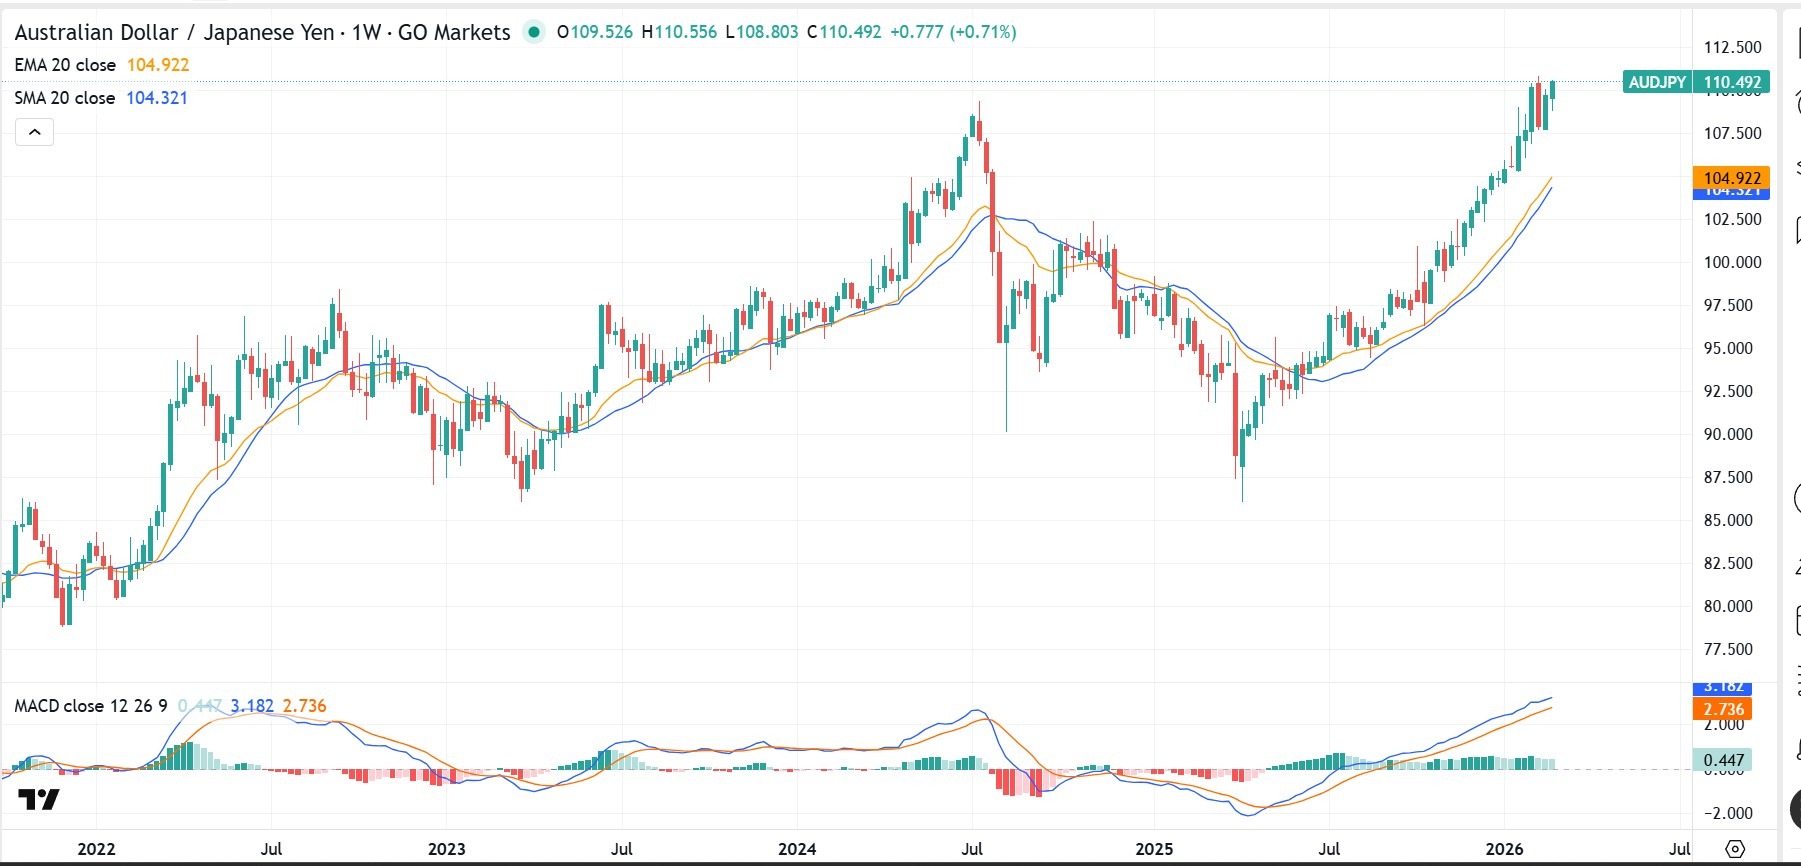
日元对国内增长数据和日本央行的政策决策仍然敏感。收益率预期和政策正常化信号继续影响美元/日元和跨日元的波动。
日本央行政策会议和随后的沟通可能会影响短期波动和长期利率预期,进而影响日元的情绪。
更强劲的GDP或强化正常化的政策信号可以通过国内收益率调整来支撑日元。更谨慎的消息可能会维持收益率差异,有利于美元和澳元。
关键图表:澳元/日元周线图
澳元 (AUD)
关键事件
- 澳大利亚国内生产总值: 3月4日上午11点30分(澳大利亚东部夏令时间)
- 澳洲联储货币政策决定: 3 月 17 日下午 2:30(澳大利亚东部夏令时间)
- 劳动力调查: 3 月 19 日上午 11:30(澳大利亚东部夏令时间)
- 消费者价格指数(CPI): 3月25日上午11点30分(澳大利亚东部夏令时间)
要看什么
澳元面临的国内日历以3月16日至17日的澳洲联储会议为中心。增长、劳动力和通货膨胀数据集中在三周的时间内,这增加了波动的可能性。
更强劲的GDP或持续的通货膨胀可能会增强政策谨慎性并支撑澳元。疲软的劳动力或消费者价格指数结果可能会打压利率预期并给澳元带来压力,尤其是兑美元和日元。
本月初的中国数据也可能影响地区情绪和澳元等与大宗商品挂钩的货币。

The information provided is of general nature only and does not take into account your personal objectives, financial situations or needs. Before acting on any information provided, you should consider whether the information is suitable for you and your personal circumstances and if necessary, seek appropriate professional advice. All opinions, conclusions, forecasts or recommendations are reasonably held at the time of compilation but are subject to change without notice. Past performance is not an indication of future performance. Go Markets Pty Ltd, ABN 85 081 864 039, AFSL 254963 is a CFD issuer, and trading carries significant risks and is not suitable for everyone. You do not own or have any interest in the rights to the underlying assets. You should consider the appropriateness by reviewing our TMD, FSG, PDS and other CFD legal documents to ensure you understand the risks before you invest in CFDs. 免责声明:文章来自 GO Markets 分析师和参与者,基于他们的独立分析或个人经验。表达的观点、意见或交易风格仅代表作者个人,不代表 GO Markets 立场。建议,(如有),具有“普遍”性,并非基于您的个人目标、财务状况或需求。在根据建议采取行动之前,请考虑该建议(如有)对您的目标、财务状况和需求的适用程度。如果建议与购买特定金融产品有关,您应该在做出任何决定之前了解并考虑该产品的产品披露声明 (PDS) 和金融服务指南 (FSG)。


