
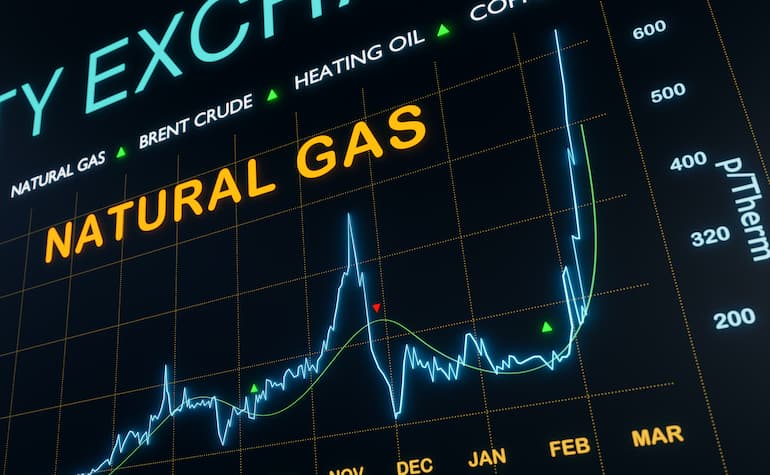
Natural Gas price action has had an amazing two years, with the usually pretty boring commodity showing extreme volatility pushing it to all time highs before a dramatic collapse seeing it back where it started in 2020. Like all the energy complex, Oil being a good example, the start of the Covid panic saw wild price fluctuations as traders came to terms with lockdowns and the related slowdowns, followed by unprecedented Central Bank stimulus. But the real push higher in Natural Gas came at the start of the war in Ukraine and the loss of Russian Gas for European suppliers, with fears of a cold winter with a much constrained supply of gas seeing the price spike to all-time highs.
But instead of a long cold gas starved winter the northern hemisphere experienced higher-than-average temperatures which meant the gas supply crunch wasn’t as dire as feared which sent liquefied natural gas prices tumbling to pre covid levels from a record all-time high. With Natural gas back to historical support levels there is a technical and fundamental case for a move higher in the near future. From a technical perspective, on a daily chart we can see that Natural Gas has found strong support since February around the 2.09 level, an historic level it found support at before the pandemic as well, we can also wee a rounding bottom pattern forming on a daily chart, this is considered one of the most reliable chart patterns in technical analysis.
According to a recent interview with Bloomberg by Yukio Kani, the chairman and CEO of Jera Co which is the worlds largest buyer of LNG, he is expecting a price spike again in natural gas this year due to Chinese re-opening demand, unusually war Northern Hemisphere weather increasing energy demand for cooling purposes and increased import capacity in Europe and China. Certainly, a market worth watching going forward!

The information provided is of general nature only and does not take into account your personal objectives, financial situations or needs. Before acting on any information provided, you should consider whether the information is suitable for you and your personal circumstances and if necessary, seek appropriate professional advice. All opinions, conclusions, forecasts or recommendations are reasonably held at the time of compilation but are subject to change without notice. Past performance is not an indication of future performance. Go Markets Pty Ltd, ABN 85 081 864 039, AFSL 254963 is a CFD issuer, and trading carries significant risks and is not suitable for everyone. You do not own or have any interest in the rights to the underlying assets. You should consider the appropriateness by reviewing our TMD, FSG, PDS and other CFD legal documents to ensure you understand the risks before you invest in CFDs. 免责声明:文章来自 GO Markets 分析师和参与者,基于他们的独立分析或个人经验。表达的观点、意见或交易风格仅代表作者个人,不代表 GO Markets 立场。建议,(如有),具有“普遍”性,并非基于您的个人目标、财务状况或需求。在根据建议采取行动之前,请考虑该建议(如有)对您的目标、财务状况和需求的适用程度。如果建议与购买特定金融产品有关,您应该在做出任何决定之前了解并考虑该产品的产品披露声明 (PDS) 和金融服务指南 (FSG)。


.jpeg)

