从科技颠覆者到国防承包商,一些市场上最受关注的公司开始了首次公开募股(IPO)的公开征程。对于交易者来说,这些首次公开上市可能代表一个独特的交易环境,但也是一个不确定性加剧的时期。
事实速览
- 首次公开募股是指私人公司首次在公共证券交易所上市其股票。
- 首次公开募股可以让交易者尽早进入高增长的公司,但波动性较大,价格历史有限。
- 上市后,交易者可以通过直接购买股票或衍生品获得对IPO股票的敞口,例如 差价合约(CFD)。
什么是首次公开募股(IPO)?
首次公开募股是指公司首次向公众发行股票。
在进行首次公开募股之前,公司的股票通常仅由创始人、早期员工和私人投资者持有。上市使任何人都可以购买股票。
根据公司的规模,它通常会在当地证券交易所上市其公开股票(例如 ASX 在澳大利亚)。但是,一些大估值公司选择只在纳斯达克等全球证券交易所上市,无论其主要总部位于何处。
对于交易者而言,首次公开募股通常是获得公司股票敞口的第一个机会。鉴于价格历史的有限和对情绪波动的敏感性,它们可以创造一个波动性和流动性增加的独特环境,但也会带来更高的风险。
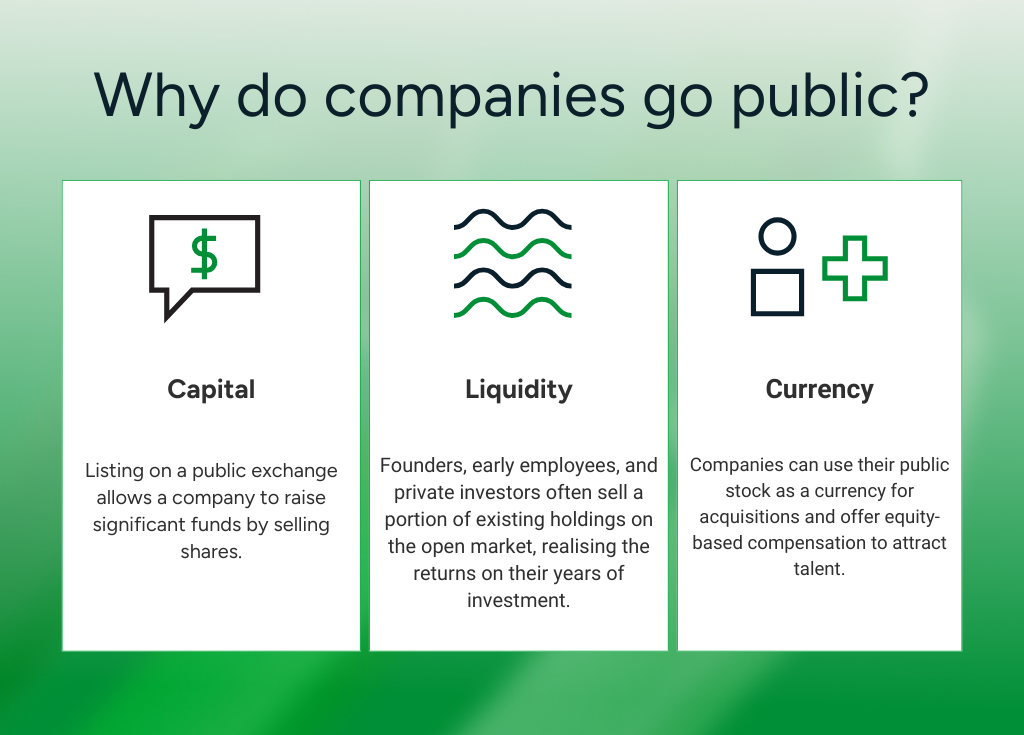
公司为什么要上市?
进行首次公开募股的最大推动力是获得更多资金。在公共交易所上市意味着公司可以通过出售股票筹集大量资金。
它还为现有股东提供流动性。创始人、早期员工和私人投资者经常在公开市场上出售其现有资产的一部分,从而实现他们多年支持的回报。
除了金钱收益外,上市还意味着公司可以使用股票作为收购的货币,并提供股权薪酬以吸引人才。公开估值提供了透明的基准,这对于战略定位和未来筹资很有用。
但是,它确实需要权衡取舍。上市公司必须遵守持续的披露和报告义务,如果许多公司专注于短期业绩,来自公众股东的压力可能会成为长期进展的障碍。
首次公开募股流程如何运作?
虽然具体情况因司法管辖区而异,但从私营公司到公开上市通常涉及以下阶段:
1。准备
公司首先选择承销商(通常是投资银行)来管理此次发行。他们共同评估公司的财务状况、公司结构和市场定位,以确定最佳的上市方法。这是确保公司真正做好上市准备的繁重规划阶段。
2。注册
一切准备就绪后,承销商将进行彻底的尽职调查,然后向相关监管机构提交所需的披露文件。这些文件向监管机构详细披露了该公司、其管理层及其拟议的发行情况。在澳大利亚,这通常是向澳大利亚证券投资委员会提交的招股说明书;在美国,这是向美国证券交易委员会提交的注册声明。
3.路演
然后,公司的高管和承销商将在 “路演” 中向机构投资者和市场分析师介绍投资案例。该展示旨在评估对股票的需求并帮助激发兴趣。机构投资者可以登记首次公开募股的利息和估值,这有助于为初始定价提供信息。
4。定价
根据路演的反馈和当前的市场状况,承销商设定了最终股价并确定了要发行的股票数量。股票在 “初级市场” 上分配给参与要约的投资者(股票在二级市场公开上市之前)。该过程设定了上市前价格,这有效地决定了公司的初始公开估值。
5。清单
上市当天,该公司的股票开始在所选证券交易所交易,正式开放二级市场。对于大多数交易者来说,这是他们可以直接或通过衍生品交易股票的第一点,例如 股票差价合约。
6。首次公开募股后
上市后,公司将受到严格的报告和披露要求的约束。它必须定期与股东沟通,公布其财务业绩,并遵守其上市交易所的治理标准。
交易者的首次公开募股风险和收益
交易者如何参与首次公开募股?
对于大多数交易者来说,一旦股票上市并开始在二级市场上交易,就可以参与首次公开募股。
股票在交易所上线后,投资者可以直接通过经纪人或在线交易所购买实物股票,也可以使用衍生品,例如 股票差价合约 在不拥有标的资产的情况下持有价格头寸。
首次公开募股交易的前几天往往波动很大。交易者应确保他们已采取适当的风险管理措施,以帮助防范潜在的价格剧烈波动。
底线
首次公开募股标志着一家公司可以向公众投资。他们可以为高增长公司的早期准入提供机会,并在波动性和市场兴趣的增加的推动下创造独特的交易环境。
对于交易者而言,在持仓之前,了解流程是如何运作的,是什么推动了定价和首次公开募股后的表现,以及如何权衡潜在回报和交易新上市股票的风险。

The information provided is of general nature only and does not take into account your personal objectives, financial situations or needs. Before acting on any information provided, you should consider whether the information is suitable for you and your personal circumstances and if necessary, seek appropriate professional advice. All opinions, conclusions, forecasts or recommendations are reasonably held at the time of compilation but are subject to change without notice. Past performance is not an indication of future performance. Go Markets Pty Ltd, ABN 85 081 864 039, AFSL 254963 is a CFD issuer, and trading carries significant risks and is not suitable for everyone. You do not own or have any interest in the rights to the underlying assets. You should consider the appropriateness by reviewing our TMD, FSG, PDS and other CFD legal documents to ensure you understand the risks before you invest in CFDs. 免责声明:文章来自 GO Markets 分析师和参与者,基于他们的独立分析或个人经验。表达的观点、意见或交易风格仅代表作者个人,不代表 GO Markets 立场。建议,(如有),具有“普遍”性,并非基于您的个人目标、财务状况或需求。在根据建议采取行动之前,请考虑该建议(如有)对您的目标、财务状况和需求的适用程度。如果建议与购买特定金融产品有关,您应该在做出任何决定之前了解并考虑该产品的产品披露声明 (PDS) 和金融服务指南 (FSG)。