The information provided is of general nature only and does not take into account your personal objectives, financial situations or needs. Before acting on any information provided, you should consider whether the information is suitable for you and your personal circumstances and if necessary, seek appropriate professional advice. All opinions, conclusions, forecasts or recommendations are reasonably held at the time of compilation but are subject to change without notice. Past performance is not an indication of future performance. Go Markets Pty Ltd, ABN 85 081 864 039, AFSL 254963 is a CFD issuer, and trading carries significant risks and is not suitable for everyone. You do not own or have any interest in the rights to the underlying assets. You should consider the appropriateness by reviewing our TMD, FSG, PDS and other CFD legal documents to ensure you understand the risks before you invest in CFDs. 免责声明:文章来自 GO Markets 分析师和参与者,基于他们的独立分析或个人经验。表达的观点、意见或交易风格仅代表作者个人,不代表 GO Markets 立场。建议,(如有),具有“普遍”性,并非基于您的个人目标、财务状况或需求。在根据建议采取行动之前,请考虑该建议(如有)对您的目标、财务状况和需求的适用程度。如果建议与购买特定金融产品有关,您应该在做出任何决定之前了解并考虑该产品的产品披露声明 (PDS) 和金融服务指南 (FSG)。
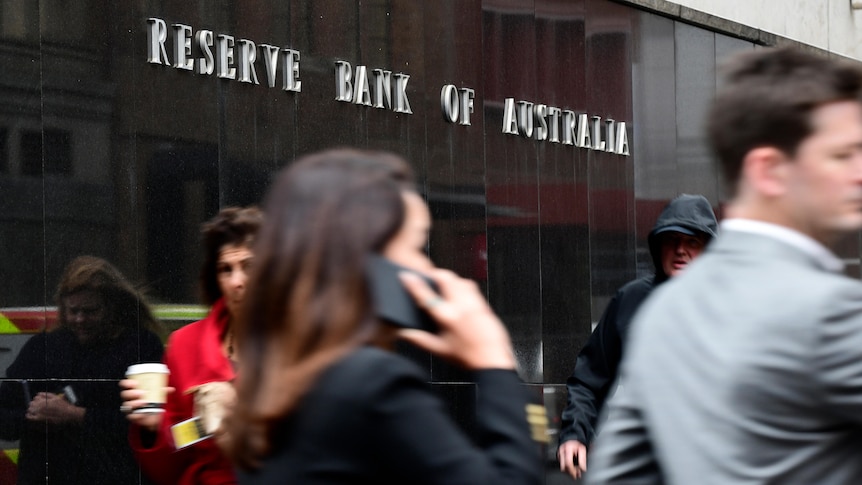
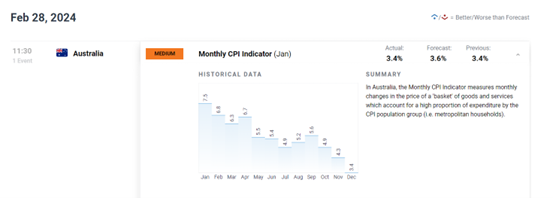
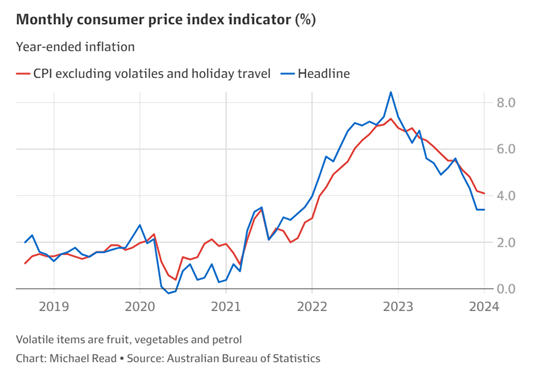
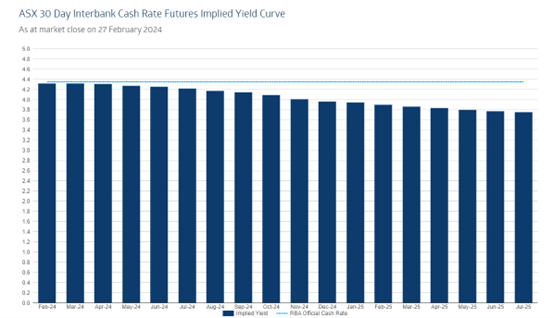
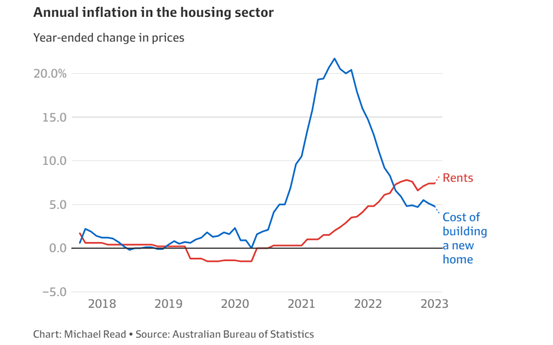
转眼间,2024年的最后几周已经到来。回顾这一年,从数据看,全球MSCI股票市场平均回报率达到两位数。尤其美股连续两年涨超20%,相反结果澳股却总觉得差了一口气。以下是我们对这一现象的分析和展望:1. 澳洲央行(RBA)利率:预期 vs 现实年初的时候,市场预计到2024年底澳洲会降息三次。然而,通胀顽固,澳洲央行不得不按兵不动以压制通胀。尽管如此,在12月的会议上,央行终于放出了鸽派信号,这种审慎的态度也为2025年的政策调整打下了基础,也预示着澳洲央行的关注点正从控制通胀逐渐转向刺激经济增长。
As tariff shocks collide with a ten year extreme in oil positioning, the margin for error is zero. See the technical markers and safe haven pivots defining the current risk environment.
135M idle barrels — days of cover against each demand benchmark
vs. Strait of Hormuz daily flow (20M bbl/day)
6.75 daysof Hormuz throughput covered
6.75 days
0
5
10
15
20
25
30 days
vs. Global oil consumption (104M bbl/day)
1.3 daysof world demand covered
1.3 days
0
5
10
15
20
25
30 days
vs. US Strategic Petroleum Reserve release (1M bbl/day)
135 daysof full SPR release pace covered
135 days — but SPR exists to replace this role
0
5
10
15
20
25
30 days
135M
idle barrels on tankers (midpoint of 120–150M range)
~33%
of daily Hormuz flow that is idle storage, not transit
<31 hrs
is all idle storage against global daily consumption
Indicative market trajectories based on disruption severity
Scenarios for the weeks ahead
1–2 WEEKS
Ceasefire catch-up
Markets face catch-up repricing. Brent could consolidate in the US$105–US$115 range as risk premia unwind. Brent may trade lower (US$95–US$110) if strategic stocks bridge the temporary shortfall.
2–4 WEEKS
Infrastructure blitz
Shifts to structural supply shock. Brent moving toward US$150–US$200 cannot be ruled out. This is the stagflation trigger where energy costs constrain central bank flexibility.
STRUCTURAL
Geopolitical floor
Iran's transit fee demand creates a permanent input cost. The pre-crisis price structure (US$60–US$70) may not return, embedded in insurance and freight rates.
Critical Threshold
US$120 remains the level at which energy inflation becomes a direct Federal Reserve policy problem.