热门话题
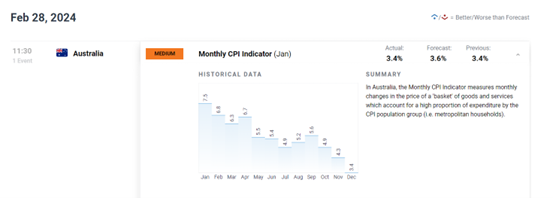
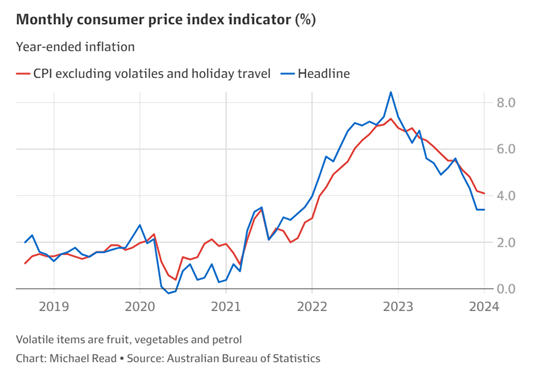
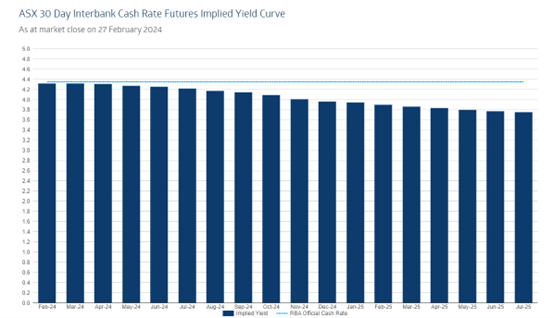
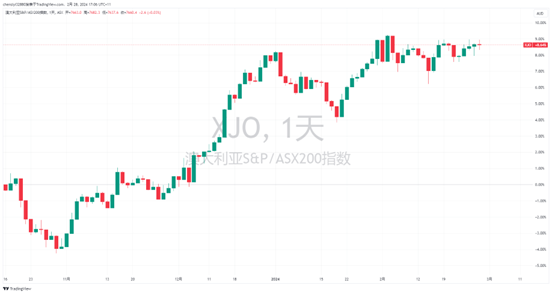
我们知道随着美国,欧洲,甚至新西兰的相继降息,市场和投资者包括房贷用户们对于澳洲什么时候也一起降息非常敏感。而伴随着联邦政府从第三季度每个月75澳元的电费补贴,以及部分州政府自己的补贴,使得即将在10月底公布的澳洲第三季度通胀数据肯定将会非常低。而且大概率可能会低于3%的关键范围内。然后,这几天各大英文媒体为了吸引眼球,就开始发表文章,说什么一旦通胀指标低于3%,就意味着达到了央行之前设定的要求,所以这些媒体认为,澳洲央行很有可能会在年底之前开始第一次降息。
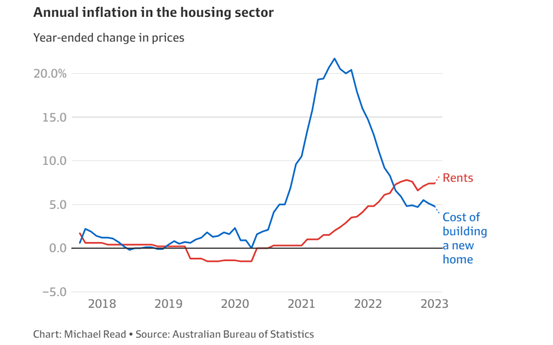
虽然说这些观点有一定道理,但是我个人认为澳洲在今年年底之前降息,99%不可能。原因很简单:1. 央行女行长已经多次明确说到,今年圣诞节之前澳洲降息基本没戏。如果再次违约,那就面临和之前上一任罗行长一样的公信力丧失。同时民众和市场对于澳洲央行以后发言的可信度也将严重打折。如果真的这样,那澳洲央行赖以支撑的预期管理方法,将难以继续。2. 澳洲目前的通货膨胀依然太高。虽然现在各级政府的能源补贴帮助降低了“纸面”上的通胀数据,但是我们都知道,一旦补贴结束,电费煤气费还是原来那个价格。而另一个关键的房租因素,虽然从明年开始留学生的数量将会削减和限制,但是这是明年以后,现在住着的留学生不会马上离开。本篇完。但是为了凑字数,也为了让观点更有说服力,我还得多写一点。除去刚才说的央行行长的信誉度很重要以外,我们都知道,澳洲央行在衡量要不要降息时,主要看三个数据:1.通胀数据2.就业数据3.经济数据而在这三大数据里,其中前两个数据,是可以通过“技术手段”来达到目标值的。对于通胀数据而言,目前联邦政府的做法是,短期用能源补贴,长期减学生来降低房租。这两个办法一个属于作弊,一个则是杀鸡取卵毁消费。而在关键的就业数据里,表面上,我们看到失业率一直维持比较低。

但是实际上,在过去2年里新增的岗位中,有一半属于Public sector,也就是政府相关岗位。换句话说,从政府公务员,到政府看大门的保安和保洁,只要劳动合约是和政府之间或间接签署的,都被归纳在Public sector。而这些职位,在我看来,也属于作弊的嫌疑。换句话说,其实不论是美国,欧洲还是澳洲,如果真的想要控制通胀,或者失业率,不需要修改统计数据,还有1000种办法可以合理,合法的影响数据。然后我们来听一些实话:澳洲新任副行长,从英国央行挖来的副行长,前几天在悉尼参加了一个会议,公开发言说到:澳洲目前的通胀依然很高,这就是为什么我们目前依然不能降息的最大原因。副行长还说,目前市场对于年底之前澳洲有可能降息的预期,是基于了国际市场(都已经开始降息),但是并没有完整的考虑本地市场的情况。
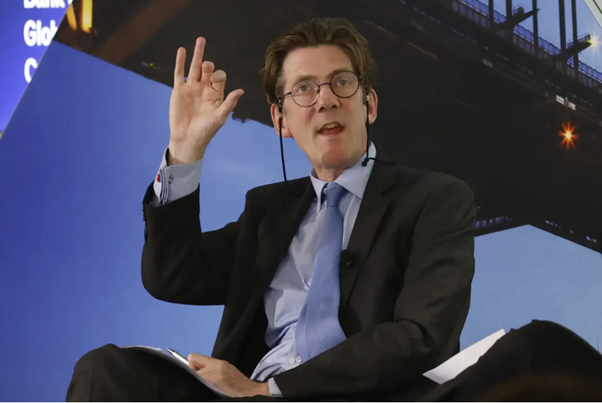
副行长明确说到,只要澳洲央行觉得澳洲的实际通胀没有真正被压下去,那就不会降息。并且补充到,即便明年通胀逐步下降,澳洲也会谨慎而有序的降息。其延申意义就是:你别指望我们和美国一样50点50点的降。总结一下:其实很多时候,那些英文媒体的财经专栏作家并不傻,也不笨,你想啊,连我都知道的大概率的事情,他们会不知道?他们混了财金媒体圈几十年,早就是老狐狸了,那为啥还会写这些明知道不可能发生的事?你说呢?还不是为了点击率和流量?还不是为了可怜的KPI?还不是为了最后反衬出央行行长顶着媒体舆论压力,坚持自己观点的形象?所以,咱们看事情要看透,不要too young too simple,别人说什么就信什么。有时候别人说什么,并不意味他们真正是这么想的。澳洲今年年底之前降息?虽然不敢说绝无可能,也至少是99%不可能。免责声明:GO Markets 分析师或外部发言人提供的信息基于其独立分析或个人经验。所表达的观点或交易风格仅代表其个人;并不代表 GO Markets 的观点或立场。联系方式:墨尔本 03 8658 0603悉尼 02 9188 0418中国地区(中文) 400 120 8537中国地区(英文) +248 4 671 903作者:
Mike Huang | GO Markets 销售总监

The information provided is of general nature only and does not take into account your personal objectives, financial situations or needs. Before acting on any information provided, you should consider whether the information is suitable for you and your personal circumstances and if necessary, seek appropriate professional advice. All opinions, conclusions, forecasts or recommendations are reasonably held at the time of compilation but are subject to change without notice. Past performance is not an indication of future performance. Go Markets Pty Ltd, ABN 85 081 864 039, AFSL 254963 is a CFD issuer, and trading carries significant risks and is not suitable for everyone. You do not own or have any interest in the rights to the underlying assets. You should consider the appropriateness by reviewing our TMD, FSG, PDS and other CFD legal documents to ensure you understand the risks before you invest in CFDs. 免责声明:文章来自 GO Markets 分析师和参与者,基于他们的独立分析或个人经验。表达的观点、意见或交易风格仅代表作者个人,不代表 GO Markets 立场。建议,(如有),具有“普遍”性,并非基于您的个人目标、财务状况或需求。在根据建议采取行动之前,请考虑该建议(如有)对您的目标、财务状况和需求的适用程度。如果建议与购买特定金融产品有关,您应该在做出任何决定之前了解并考虑该产品的产品披露声明 (PDS) 和金融服务指南 (FSG)。